
Where Are We Now?
Seniors are eagerly awaiting their decisions, while juniors are starting to strategize for next year’s applications. Many students rely on past admissions trends to guide their application choices. However, while recent data from the past one or two years is widely available, finding long-term trends is much more challenging.
That’s where I come in. Today, I’ll break down six years of admissions data from top schools, helping you identify key patterns and predict how this year’s Regular Decision (RD) results may shape up.

To simplify the data, I’ve structured my analysis by school. When reviewing the tables, keep in mind:
- Top Table → Early Decision (ED) / Early Action (EA) Analysis
- Bottom Table → Regular Decision (RD) Analysis
- Blue Background → Standardized Testing Required
- Pink Background → Test-Optional Policy
The top number represents total applicants, while the bottom number shows accepted students (not enrolled students).
School-Specific Analysis
MIT

MIT is one of the most transparent schools when it comes to admissions data, making it an excellent case study for trend analysis.
- Test-Optional Impact: When MIT moved to a test-optional policy for the Class of 2025, applications surged. However, since the class size remained the same, the acceptance rate plummeted.
- Test Reinstatement: For the Class of 2027, MIT reinstated standardized testing requirements, leading to fewer EA applications and a slight increase in acceptance rates.
- RD Predictions: Given that EA acceptance numbers were higher than last year, MIT is expected to admit fewer students in RD. With 16,000 RD applicants, I predict an RD acceptance rate of 3.6%.
Harvard

Harvard remained test-optional until this year. For the Class of 2029, they have reinstated the standardized testing requirement.
- Test-Optional Impact: Harvard’s test-optional policy initially led to a surge in applicants, cutting early acceptance rates in half (from 13.9% to 7.4%).
- RD Predictions: With required testing back, RD applications are expected to decrease slightly. This could raise the RD acceptance rate to around 3.0%, offering a marginally better shot to borderline applicants.
- Early vs. RD Trends: While some sources claim Harvard is admitting more students in early rounds, a large number of applicants are being deferred, making RD just as competitive.
Stanford

Stanford does not publicly release detailed admissions data, so I will not be analyzing it here.
Yale

Yale’s early application trends highlight the broader impact of test-optional policies.
- Test-Optional Effect: When Yale adopted test-optional policies, EA applications increased significantly. Unlike other schools, however, Yale maintained a steady acceptance rate.
- Test-Flexible Approach: For the Class of 2028, Yale reinstated testing but allowed for flexible submissions. This slightly reduced applications, boosting the EA acceptance rate.
- RD Predictions: With 2,300 total spots and 700 already filled in early rounds, I predict a 3.6% RD acceptance rate—a small increase from last year.
Duke

- Brown vs. HYPSM Effect: Duke benefited from test-optional policies, as many applicants who would have aimed for HYPSM schools instead applied to Duke.
- Early Trends: Brown set a record-low early acceptance rate due to increased applications.
- RD Predictions: With an estimated 48,000 total applicants, Duke’s RD acceptance rate is projected to be 4.27%, similar to last year.
Johns Hopkins University (JHU)

- Test-Optional Impact: JHU remains test-optional this cycle but will require standardized tests starting next year.
- RD Predictions: Given recent trends, I predict JHU’s RD acceptance rate will drop below 4.5%.
Northwestern

- Early Trends: Northwestern admitted a record number of students in ED this year.
- RD Predictions: With an estimated 47,000 RD applicants, I predict an RD acceptance rate of 5.5%.
University of Pennsylvania

- Test-Optional Ripple Effect: With Cornell and Brown reinstating standardized testing, more applicants turned to Penn, leading to a record-high application volume.
- RD Predictions: Expect a historically low acceptance rate, making this one of Penn’s most competitive years.
Cornell

- Test-Optional Reversal: Like Harvard, Cornell saw an application surge under test-optional policies, though the acceptance rate remained stable.
- RD Predictions: With 7,800 Early applicants and 1,750 admitted (22% acceptance rate), I expect Cornell’s RD acceptance rate to be 6.9%.
Brown
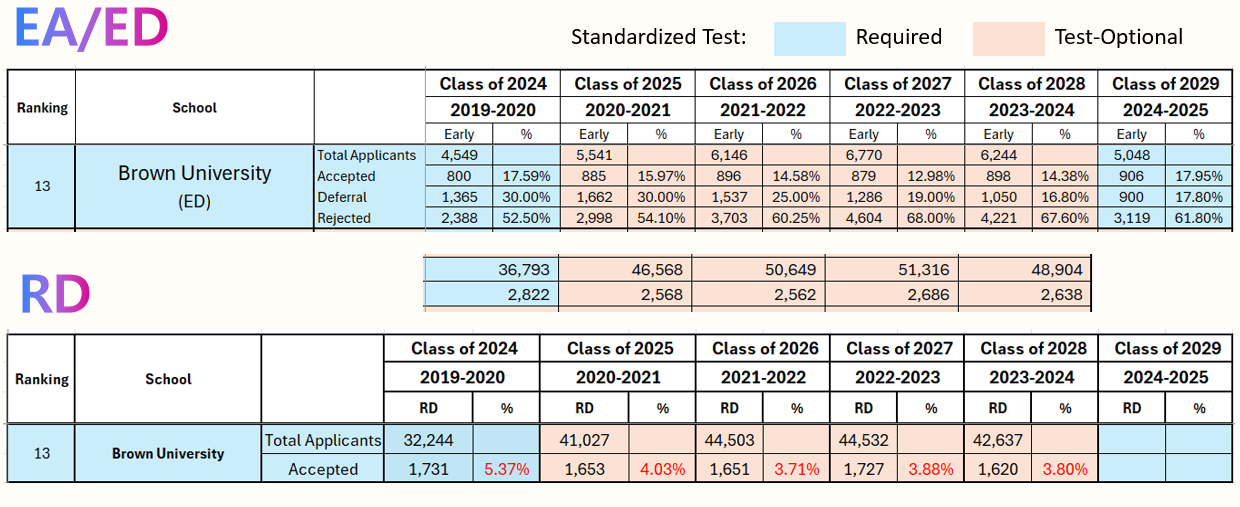
- Test-Optional Reversal: Brown reinstated standardized testing, leading to fewer early applications, but early acceptance rates slightly increased.
- RD Predictions: With 36,200 applicants and 1,700 accepted, I predict an RD acceptance rate of 4.6%.
Columbia

- RD Predictions: No major changes expected; acceptance rates should remain similar to last year.
Dartmouth
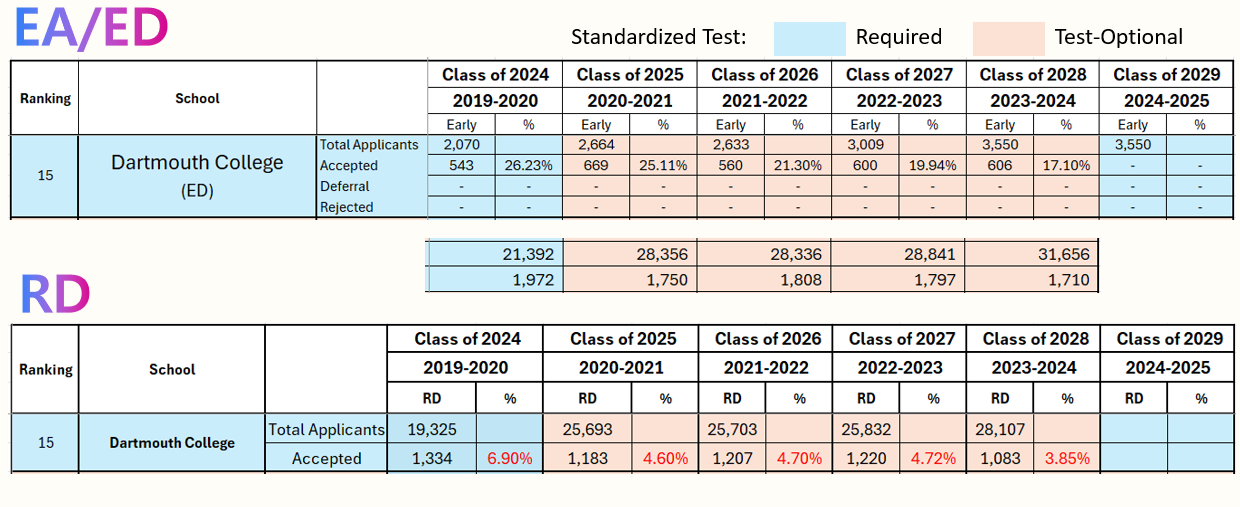
- Test Reinstatement with No Drop in Apps: Unlike other schools, Dartmouth’s application volume remained steady despite reinstating test requirements.
- RD Predictions: With slightly fewer RD applications, the RD acceptance rate could rise to around 5%.
Rice

- Early Trends: Rice admitted a historically high number of ED 1 and ED 2 applicants.
- RD Predictions: Expect 30,000 RD applicants and a 6.36% acceptance rate.
Notre Dame

- RD Predictions: Similar to last year—RD remains a solid option.
Vanderbilt

- RD Predictions: Slight increase in applications may push the RD acceptance rate slightly lower.
Class of 2029 RD Summary (Excluding UC Schools)
- Harvard/Yale → Slight RD acceptance rate increase but still ultra-competitive.
- Duke → Similar to last year.
- JHU → More competitive than last year.
- Northwestern → RD acceptance rate slightly lower than last year.
- Penn → Historically low RD acceptance rate expected.
- Cornell/Brown → Stronger chances for high-scoring applicants.
- UChicago/Columbia → No major changes from last year.
- Dartmouth → Lower RD applicant pool = slightly better odds.
- Rice → Similar to last year.
- Notre Dame → RD remains a strong option.
- Vanderbilt → Slightly lower RD acceptance rate.
Final Thoughts

As we approach RD decisions, understanding trends is key to making informed application choices. While overall acceptance rates remain low, test-optional policies, early admission trends, and school-specific changes all play a role in shaping RD outcomes.
I hope this data helps you strategize for your applications!
For further inquiries, feel free to contact A-One Institute.
Thank you!
Regular Decision
Strategy
Class of 2029